
Featured Article:
Author: Sai Nikhilesh Kasturi, Data Science & Analytics, Customer Insights & Analysis, American Airlines
One of the foremost interesting and challenging things about data science hackathons in Kaggle is struggling to maintain the same ranks on both public and private leader boards. I also have been a victim in struggling to keep the same ranks on both the leader boards and losing my rank when my results got validated on a private leader board.
Did you ever think of what could be the possible reason for high variation in these ranks? In other words, why does a model lose stability when evaluated on the private leader board?
Losing my rank on the leader board made me find answers for this problem, I discovered the phenomenon which brings such variations on the leader board. In this article, we’ll discuss the possible reason for this. we’ll also learn about cross-validation and various methods to perform it.
Stability of a model?
There is always a requirement to validate the stability of your machine learning model. In other words, you only can’t fit the model on your training data & predict it for future dates and hope it might accurately give results every time. Why I am stressing more on this because every time the model predicts for future dates, it predicts based on unseen data which can be different from the training data. If the trained model doesn’t capture trends from your training data, then it might overfit or underfit on the test set. In other words, there might be high variance or bias.
Let’s understand more about the stability of a model by citing an example.
Here in this example, we are trying to find the relationship between a person buys a car or not based on his income. To achieve this, we have taken the following steps:
We’ve established the relationship using a linear equation between car bought or not and income of the person. Suppose, say you have data from 2010 to 2019 and trying to predict for 2020. You have trained your model based on the available train data.

In the first plot, we can say that the model has captured every trend of the training data including noise. The accuracy of the model is very high with minimal error. This is called overfitting because the model has considered each deviation in the data point (including noise) and the model is too sensitive and captures every pattern which is present only in the current dataset. Due to this very reason, there could be a high deviation between the public and private leader boards.
In the second plot, we just found the optimum relationship between the two variables, which is low training error and more generalization of the relationship.
In the third plot, we found that the model is not performing well on the train data and has low accuracy and higher error %. Therefore, this kind of model will not perform well on either public or the private leaderboards. This is a classic example of Underfitting. In this case, our model fails to capture the underlying trend of the training data.
A common practice seen in many machine learning competitions in Kaggle is to iterate over various models to seek out a far better-performing model. However, it becomes difficult to differentiate whether this improvement in score is coming because we are capturing the relationship of the variables better, or we are just over-fitting on the training data. To understand more about this, many people in the machine learning forums use various validation techniques. This helps in achieving more generalized relationships and maintains the stability of the model.
What is Cross-Validation?
Cross-validation is a statistical validation technique used in machine learning to assess the performance of a machine learning model. It uses the subset of the data-set, trains on it then assess the model performance using the complementary subset of the data-set which is not used for training. It serves as an assurance that the model is correctly capturing patterns from the data, without considering noise from the data.
Standard steps used in Cross-Validation:
It divides the data set into two parts — training and testing.
It trains the model on the training dataset.
It evaluates the same model on the testing set.
There can be different flavours of cross-validation techniques.
Various methods used in Cross Validation:
1. Validation Method or Train_Test_Split:
This is a basic cross-validation technique used. In this technique, we use a subset of the data as the training data on which the model trains and assess the model performance on the other set of the data which is called the test set which can be seen in the picture above. The error estimation then tells how our model is doing on unseen data or the test set. This is a simple kind of cross-validation technique, also known as the validation method. This technique suffers from issues of high variance. This is because it is not certain which data points will end up in the test set or train set & which leads to huge variance and also the result might be entirely different for different sets.
2. N-Fold Cross Validation/ K-Fold Cross Validation:
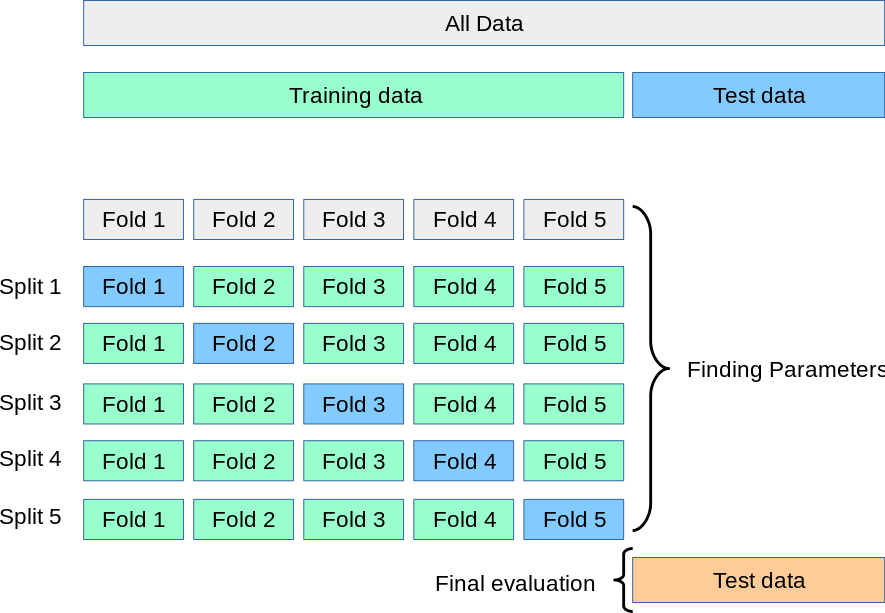
As there is always need of good amount of data points to train your model, splitting a part of the data for test set could leave the model in not understanding the patterns in the data which could lead to increase in error & bais and also could lead to underfitting of the model on the test data. For this problem to overcome, there is a technique in cross-validation which provides ample data for training the model and also leaves ample data for validation. K Fold cross-validation does exactly that.
Steps involved in N-fold cross-validation:
- Split your entire dataset based on N- folds.
- For each N-fold in your dataset, build your model on N-1 folds of the dataset. Then, test the model to check the effectiveness for Nth fold
- Record the error for each iteration on the predictions. Repeat this until each of the N-folds has served as the test set
- The average of your N recorded errors is called the cross-validation error and will serve as your performance metric for the model.
For example:
Suppose your data has 100 data points. Based on the 100 data points, you want to predict the next data point. Then 100 records can be used for cross-validation. Let’s say, number of folds(N) = 10.
- 100 data points get divided into 10 buckets with 10 records each.
- Here, as 10 folds have been created based on data and N value. Now, out 10 folds, 9 folds will be used as your training data and test your model on your 10 fold. Iterate this process until each fold becomes your test. Compute the average of the metric you choose across all folds. This metric will help in generalizing the model better and also increases the stability of the model.
3. Leave one out cross validation (LOOCV)
In this approach, we keep aside one data point from the available dataset and train the model on the rest of the data. This process iterates until every data point is used as a test set. This also has its advantages and disadvantages. Let’s look at them:
- We make use of all data points, hence the bias will be low
- We repeat the cross-validation process n times based on the number of data points available in the dataset which results in higher execution time and higher compute.
- This technique could mislead us based on the model accuracy because we are only testing on one data point, if that test data point is an outlier it could lead to high error % and we cannot generalize the model based on this kind of technique.
4.Stratified N-Fold Cross Validation:
In some cases, there may be a large imbalance in the data. For such data, a different cross-validation technique is used which is known as Stratified N-fold cross-validation, such that each fold is balanced and contains approximately the same number of samples of each class. Stratification is the technique of rearranging the data to ensure each fold has a good representative of all classes present in the data.
For example, in dataset concerning person’s income prediction, there might be a large number of people below or above 50K. it is always best to arrange the data such that in every fold comprises almost half the instances of each class.
5. Cross Validation for time series:
Splitting a time-series dataset randomly into the number of folds does not work because this type of data is time-dependent. Cross-validation on this type of data should be done across time. For a time series forecasting problem, we perform cross-validation in the following manner.
- Folds for time series cross-validation are created in a forward-chaining fashion.

Suppose for example we have a time series for yearly car demand for a company during a period of 6 years from 2014 to 2019. The folds would be created like:
Train 1— [2014]
Test 1— [2015]
Train2–[2014,2015]
Test2 — [2016]….so on
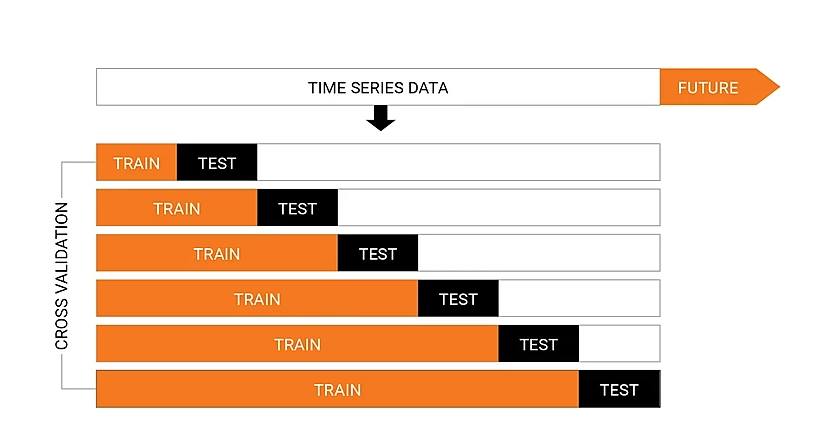
We progressively select a new train and test set. We choose a train set which has a minimum number of observations needed for fitting the model. Progressively, we change our train and test sets in each fold.
End Notes
In this article, we discussed overfitting, underfitting, model stability and various cross-validation techniques to avoid overfitting and underfitting. We also looked at different cross-validation techniques like validation method, LOOCV, N-fold cross-validation, stratified N-fold and so on.
Title picture: freepik.com
India’s largest platform for AI & Analytics leaders, professionals & aspirants
3AI is India’s largest platform for AI & Analytics leaders, professionals & aspirants and a confluence of leading and marquee AI & Analytics leaders, experts, influencers & practitioners on one platform.
3AI platform enables leaders to engage with students and working professionals with 1:1 mentorship for competency augmentation and career enhancement opportunities through guided learning, contextualized interventions, focused knowledge sessions & conclaves, internship & placement assistance in AI & Analytics sphere.
3AI works closely with several academic institutions, enterprises, learning academies, startups, industry consortia to accelerate the growth of AI & Analytics industry and provide comprehensive suite of engage, learn & scale engagements and interventions to our members. 3AI platform have 16000+ active members from students & working professionals community, 500+ AI & Analytics thought leaders & mentors and an active outreach & engagement with 430+ enterprises & 125+ academic institutions.